Produce a ggplot2 Boxplot
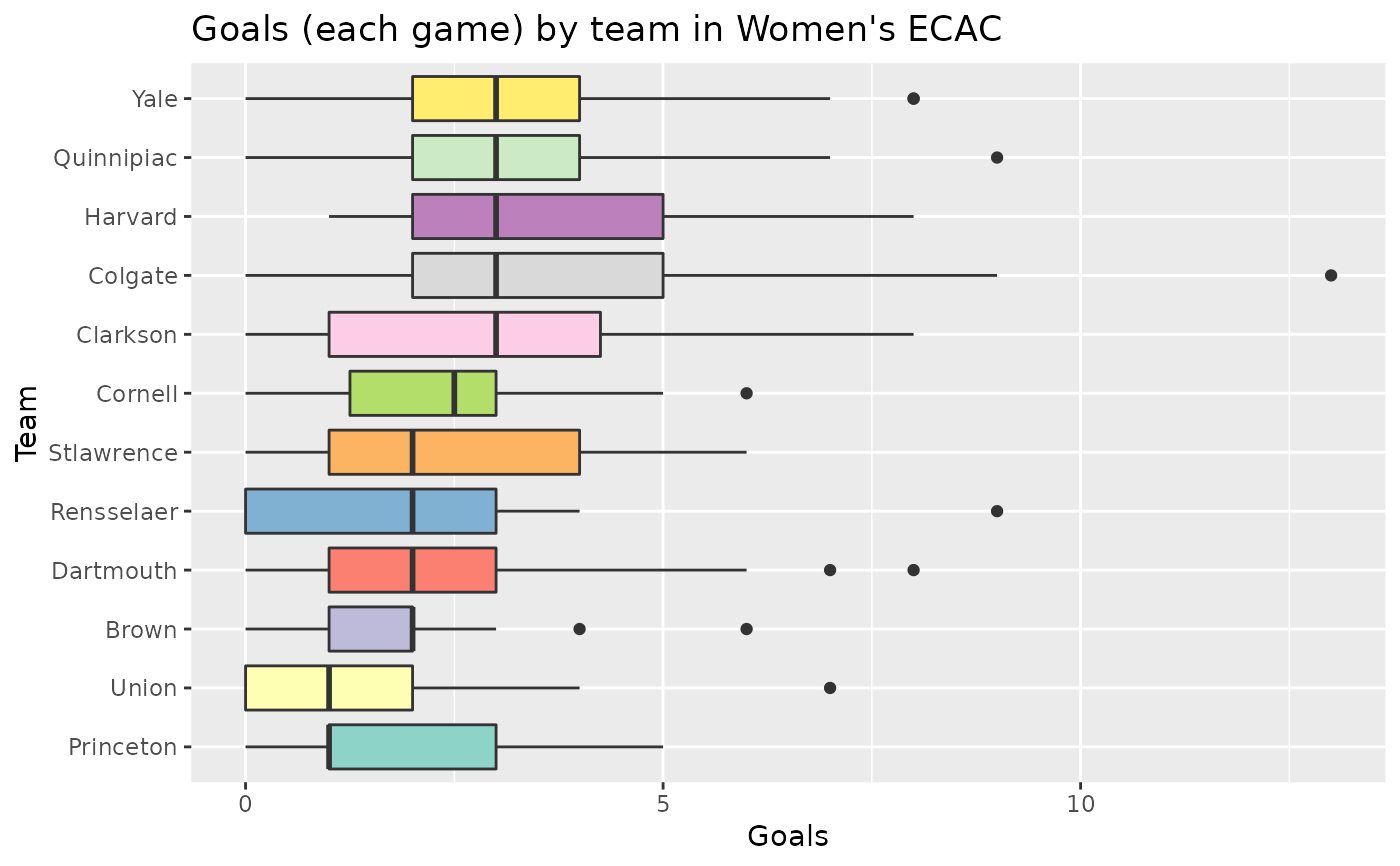
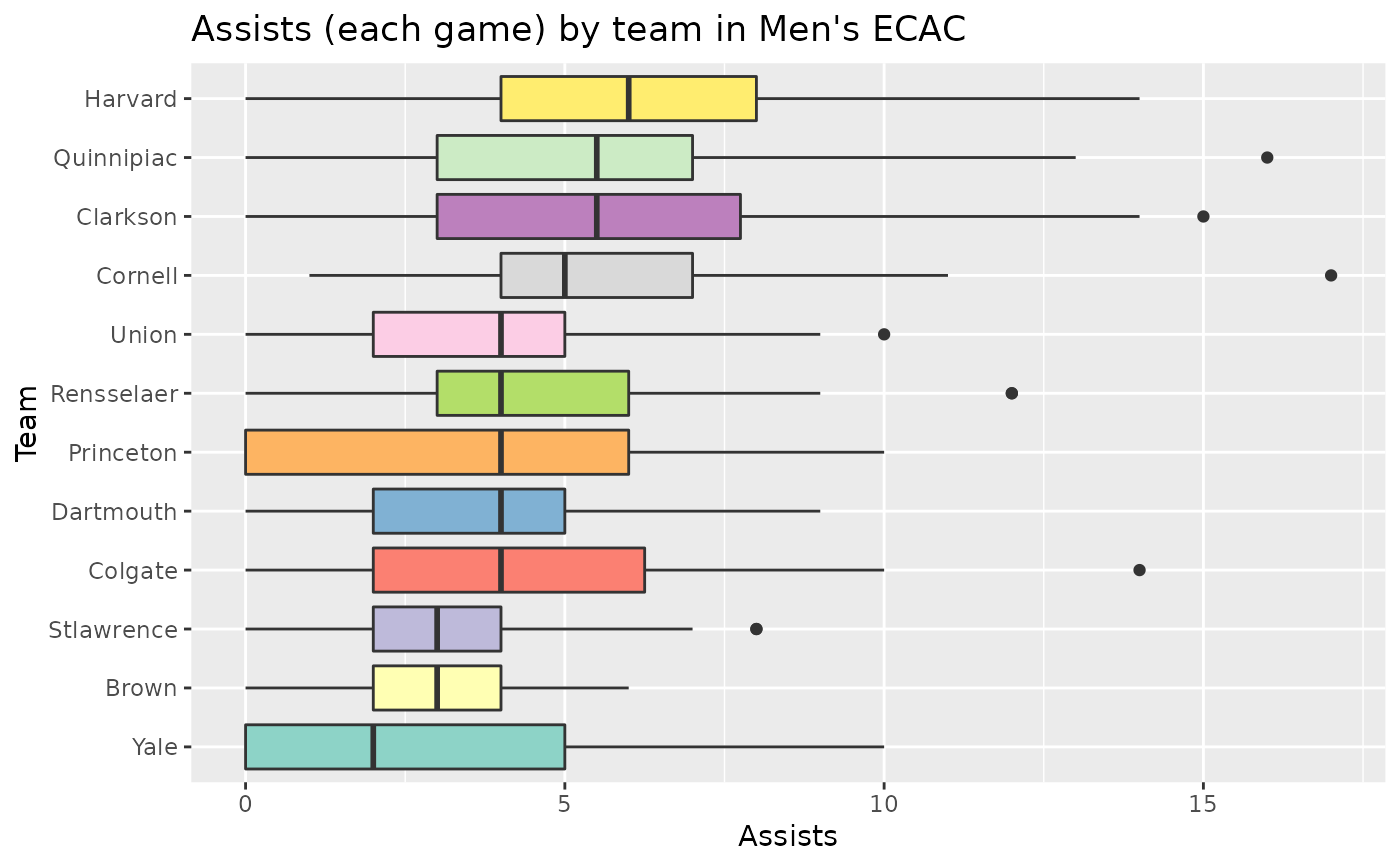
boxplot.RdCreate a ggplot2 boxplot displaying the distribution of a given variable. Does so by grouping the variable of choice by ECAC team, and displaying the value of variable for each ECAC game.
boxplot.RdCreate a ggplot2 boxplot displaying the distribution of a given variable. Does so by grouping the variable of choice by ECAC team, and displaying the value of variable for each ECAC game.