Create a ggplot2 histogram object displaying the distribution of a given statistic among
all ECAC players of a single gender (women or men)
Usage
histogram(
  var,
  games = "all",
  players = "goalies",
  gender = "women",
  verbose = TRUE
)
Arguments
- var
variable to plot
- games
graphing 'all' (default), 'conference', or 'nonconference' games. Currently no support for 'nonconference' games
- players
type of players stats to graph, 'goalies' (default) or 'skaters'
- gender
'women' (default) or 'men'
Value
a ggplot2 histogram object
Examples
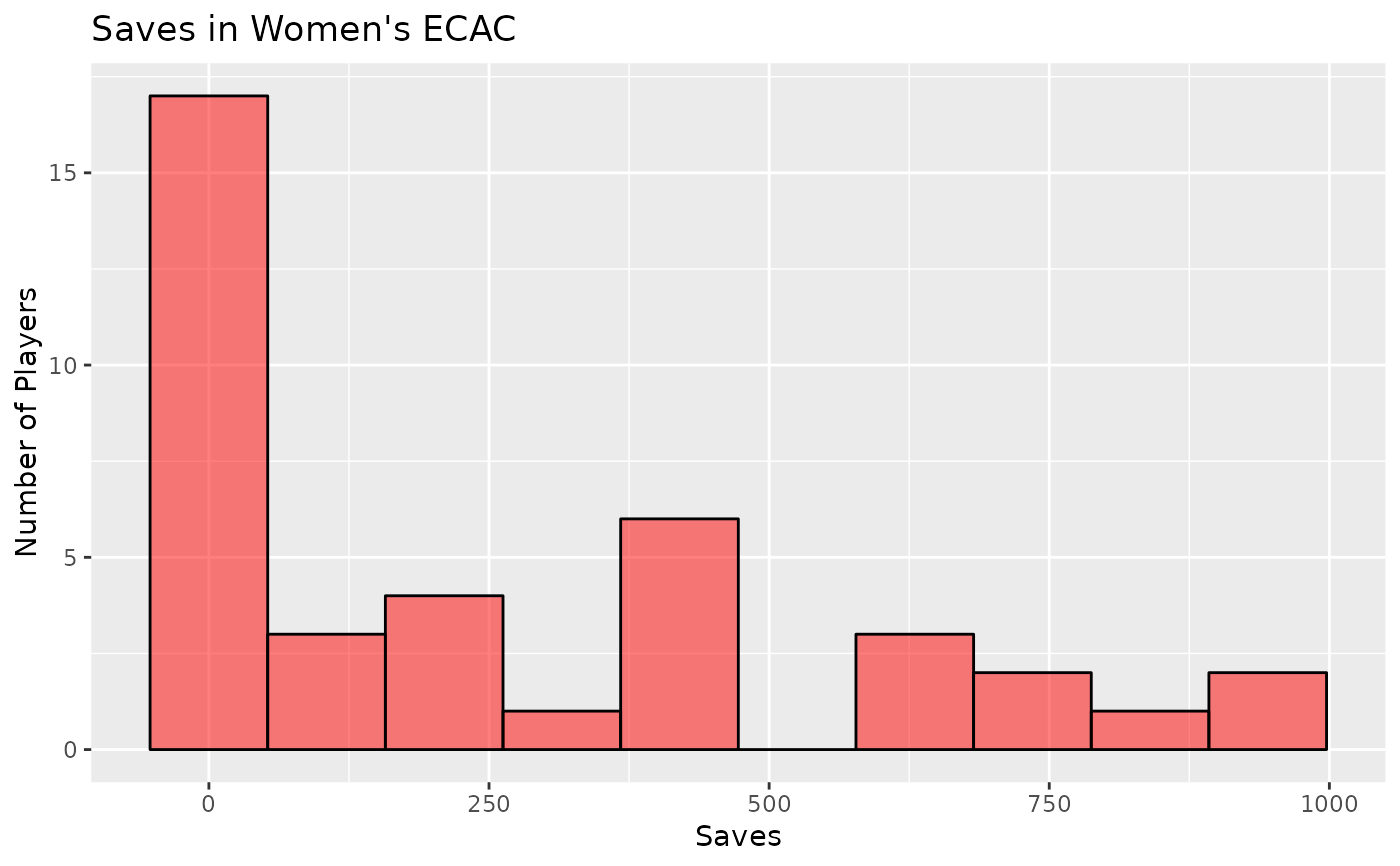
histogram(var="Saves", verbose=FALSE)
#> Warning: Removed 3 rows containing non-finite values (stat_bin).
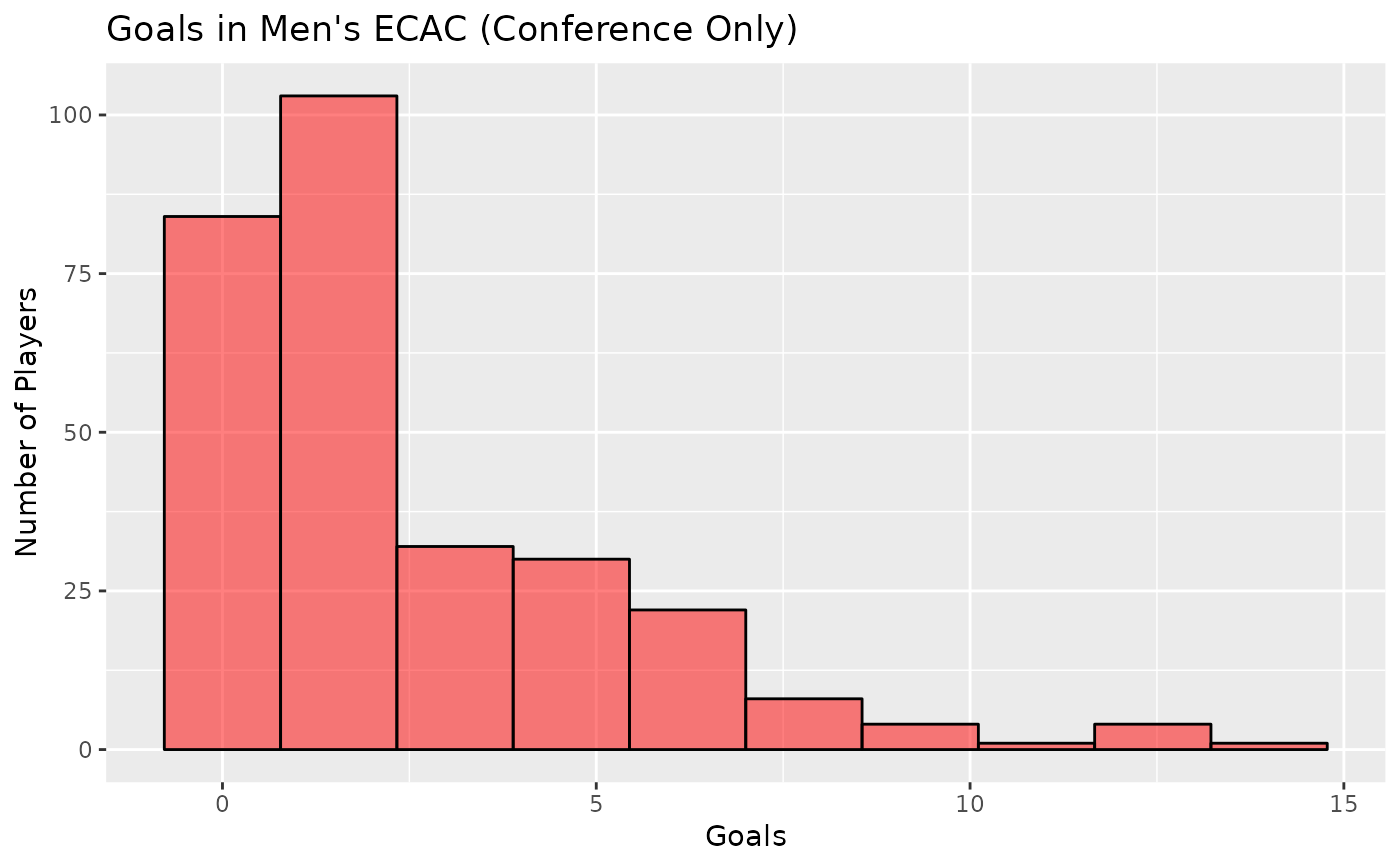
 histogram(var="Goals", games="conference", players="skaters", gender="men", verbose=FALSE)
#> Warning: Removed 13 rows containing non-finite values (stat_bin).
histogram(var="Goals", games="conference", players="skaters", gender="men", verbose=FALSE)
#> Warning: Removed 13 rows containing non-finite values (stat_bin).