Produce a ggplot2 Lollipop Chart
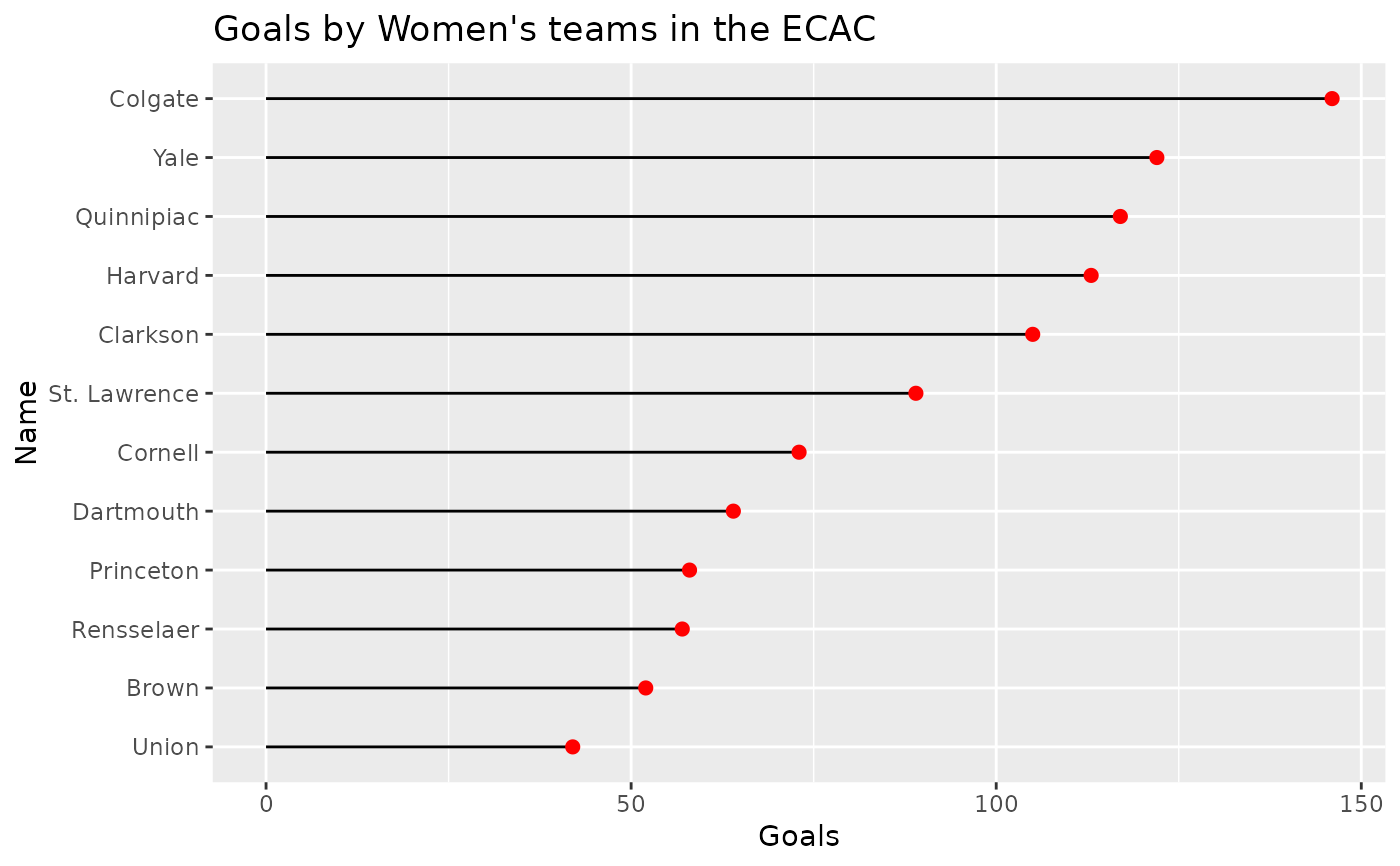
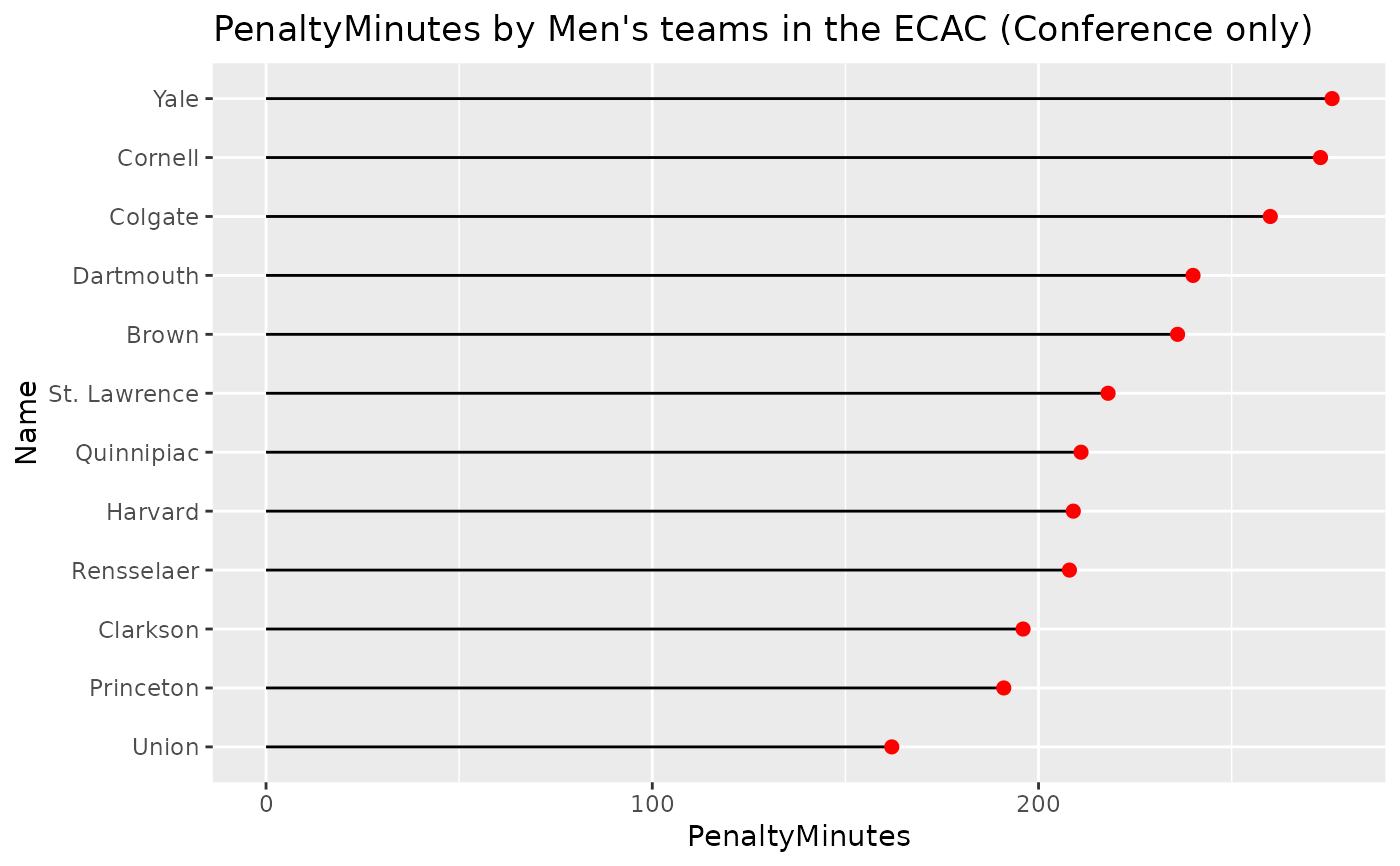
lollipopChart.RdCreate a ggplot2 lollipop chart (alternative to a bar chart) of overall season summary statistics of all ECAC teams.
lollipopChart.RdCreate a ggplot2 lollipop chart (alternative to a bar chart) of overall season summary statistics of all ECAC teams.