Produce a Chart of Individual Overall Season Leaders
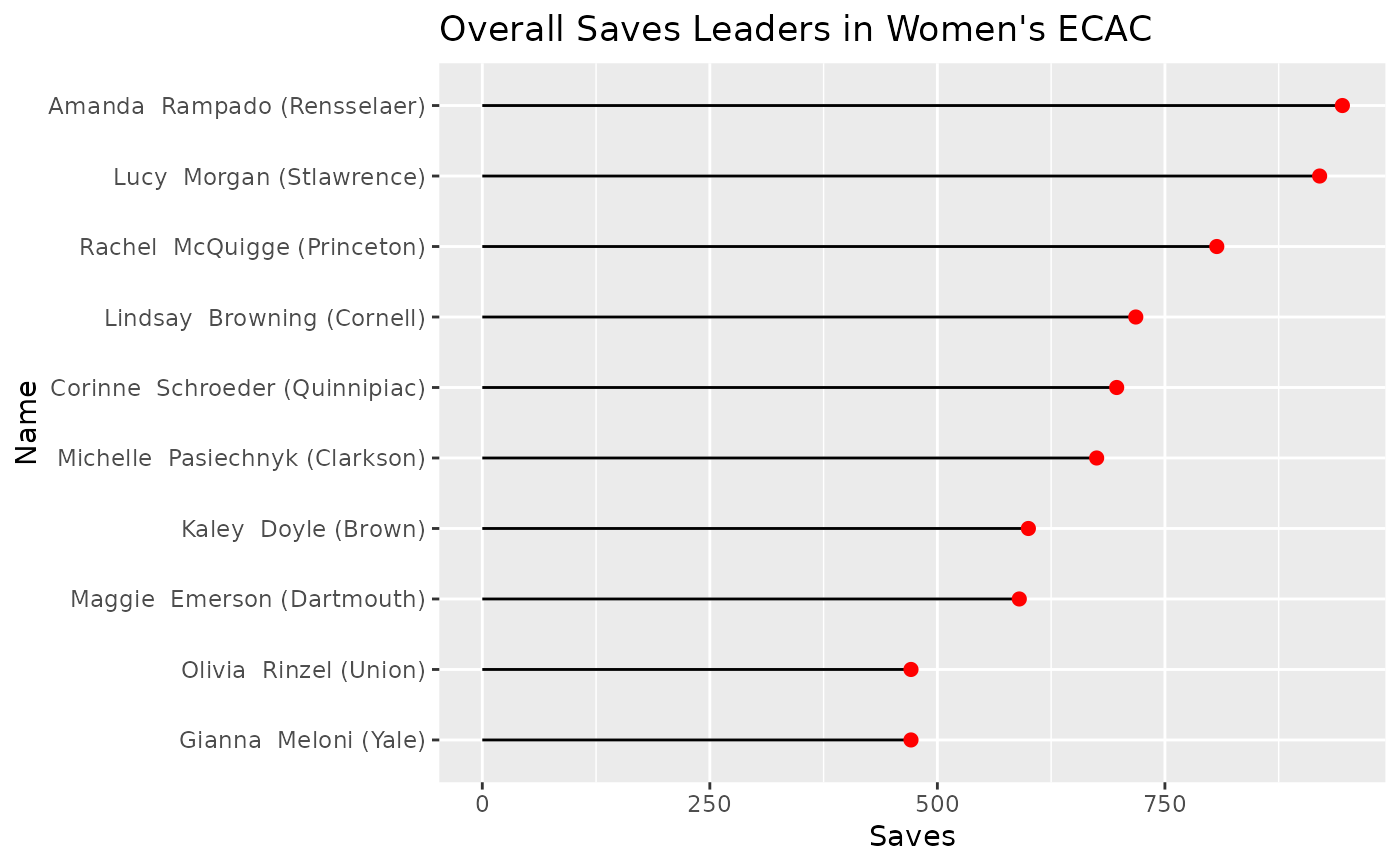
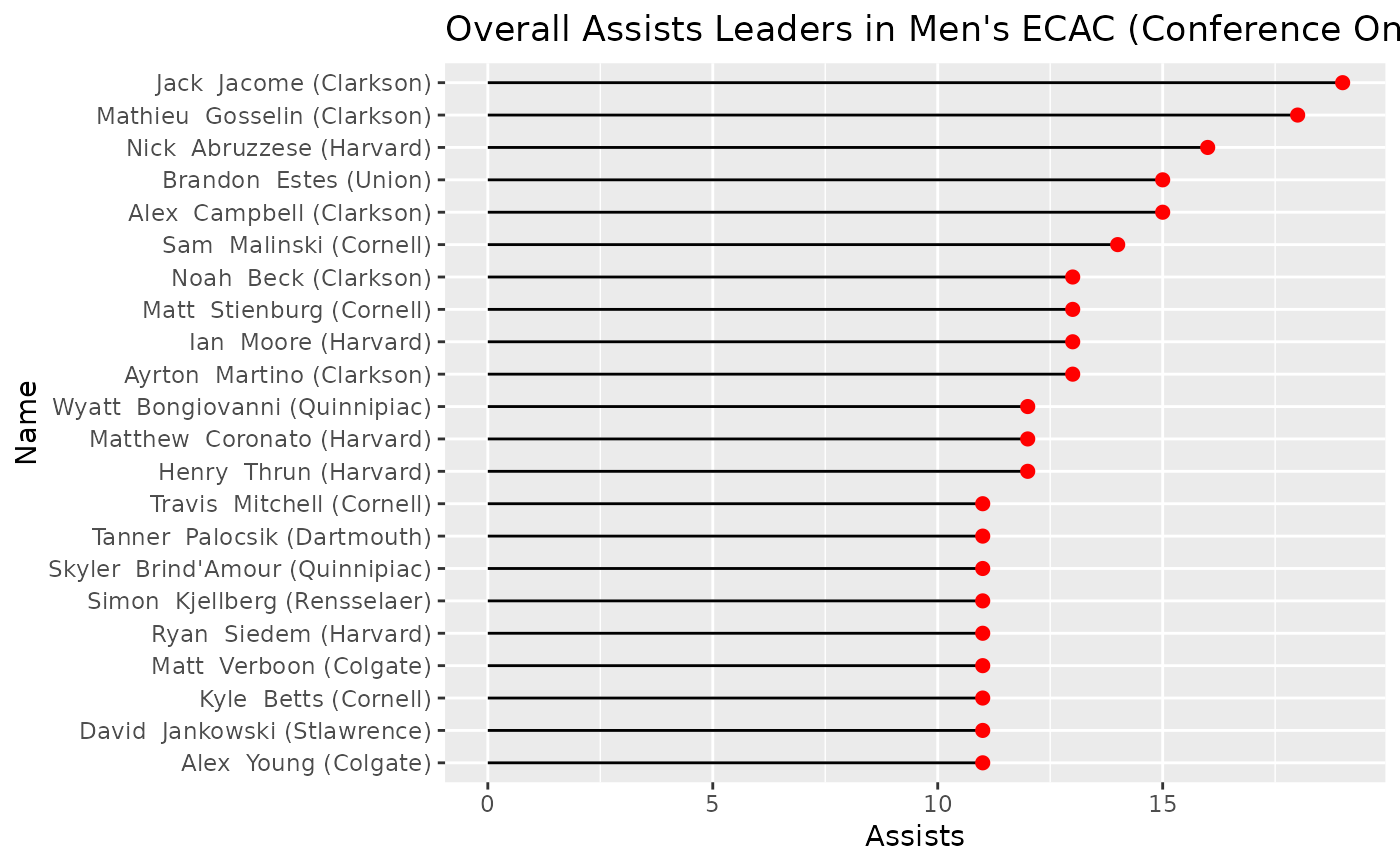
overallLeaders.RdCreates a ggplot2 lollipop chart (bar chart alternative) object. Displays the overall individual leaders of a given player statistic. Also provides the player's team.
Usage
overallLeaders(
  var,
  n_leaders = 10,
  games = "all",
  players = "goalies",
  gender = "women",
  verbose = TRUE
)
Arguments
- var
summary statistic to plot
- n_leaders
number of leaders to plot (default is 10)
- games
graphing 'all' (default), 'conference', or 'nonconference' games. Currently no support for 'nonconference' games
- players
type of players stats to graph, 'goalies' (default) or 'skaters'
- gender
'women' (default) or 'men'
- verbose
TRUE (default) for intermediate data scraping output messages, FALSE for no additional output

